While we have covered all of the HTTP concepts you need to know at this point, it's worth spending some time explaining how web browsers submit requests and receive responses.
Tip
This section requires you to use Firefox's developer tools. If you need a refresher or just a reference, visit MDN.
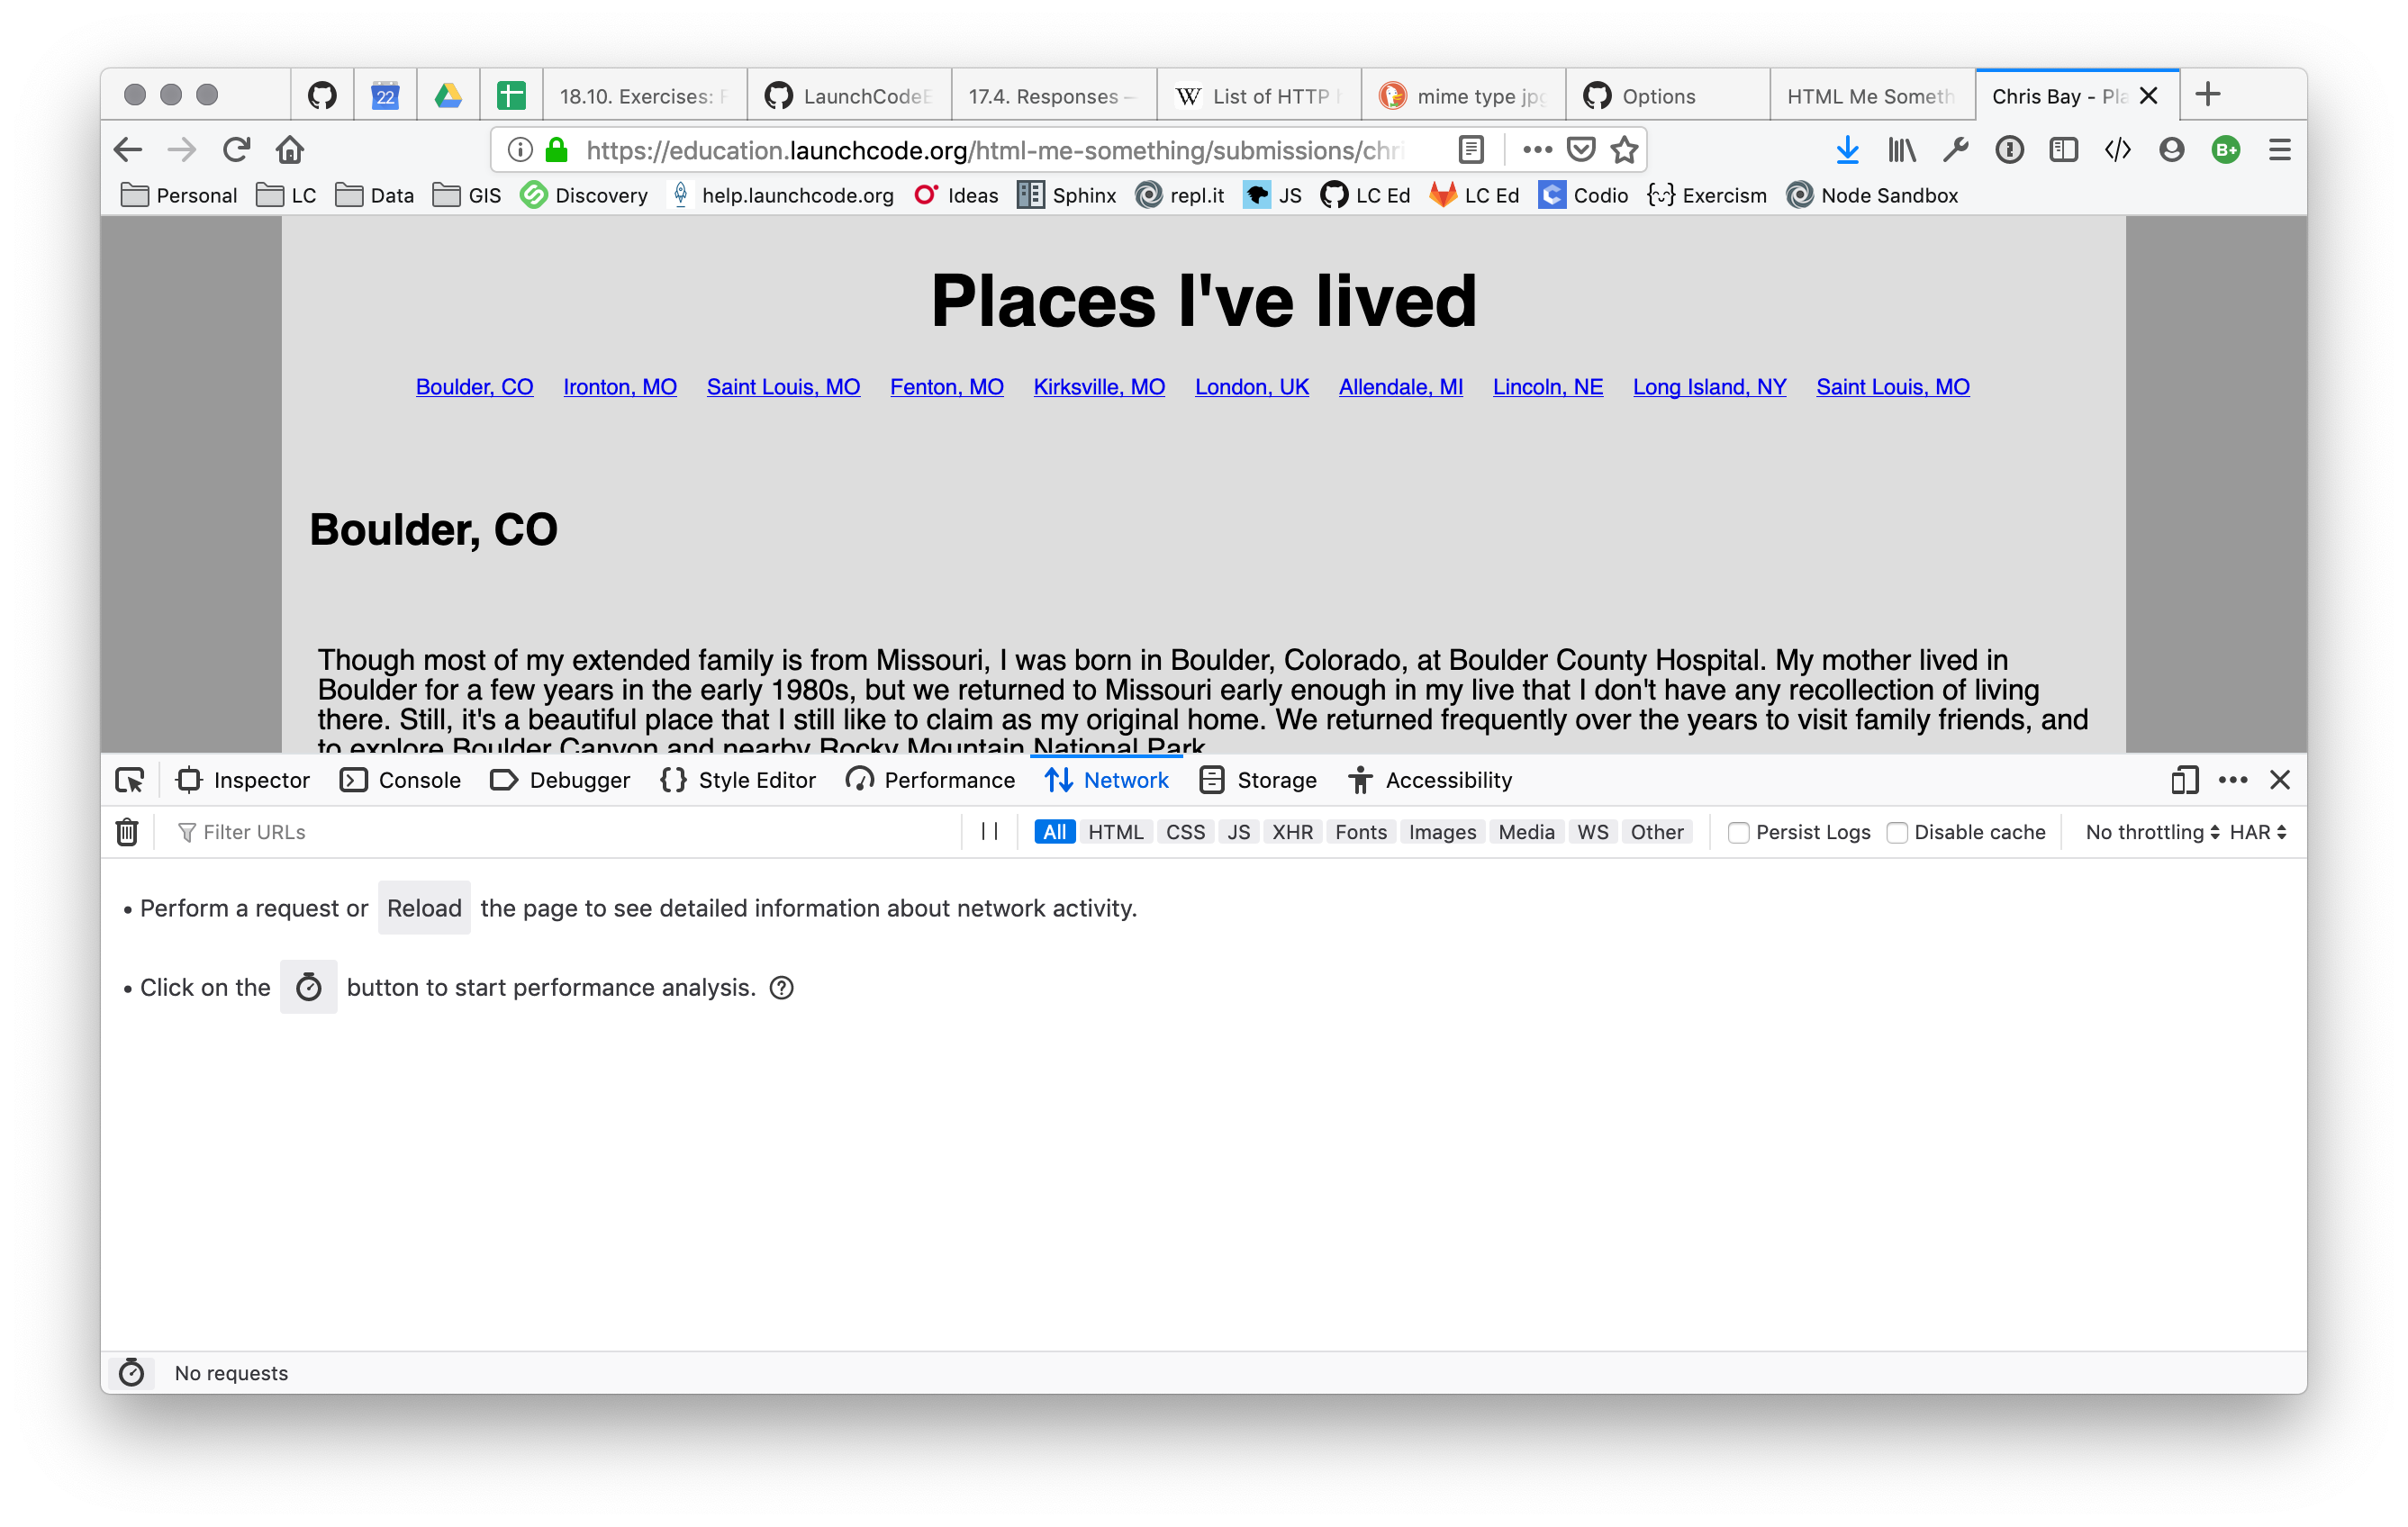
Open a web browser and visit some web page, say, our example from the HTML Me Something assignment. After the page loads, open your browser's developer tools and select the Network tab.
You'll see something like this:

The Network pane displays all HTTP requests and responses involved in loading a page. However, it only tracks and displays such data if it is open during the request. To see some data in this tab, refresh the page.
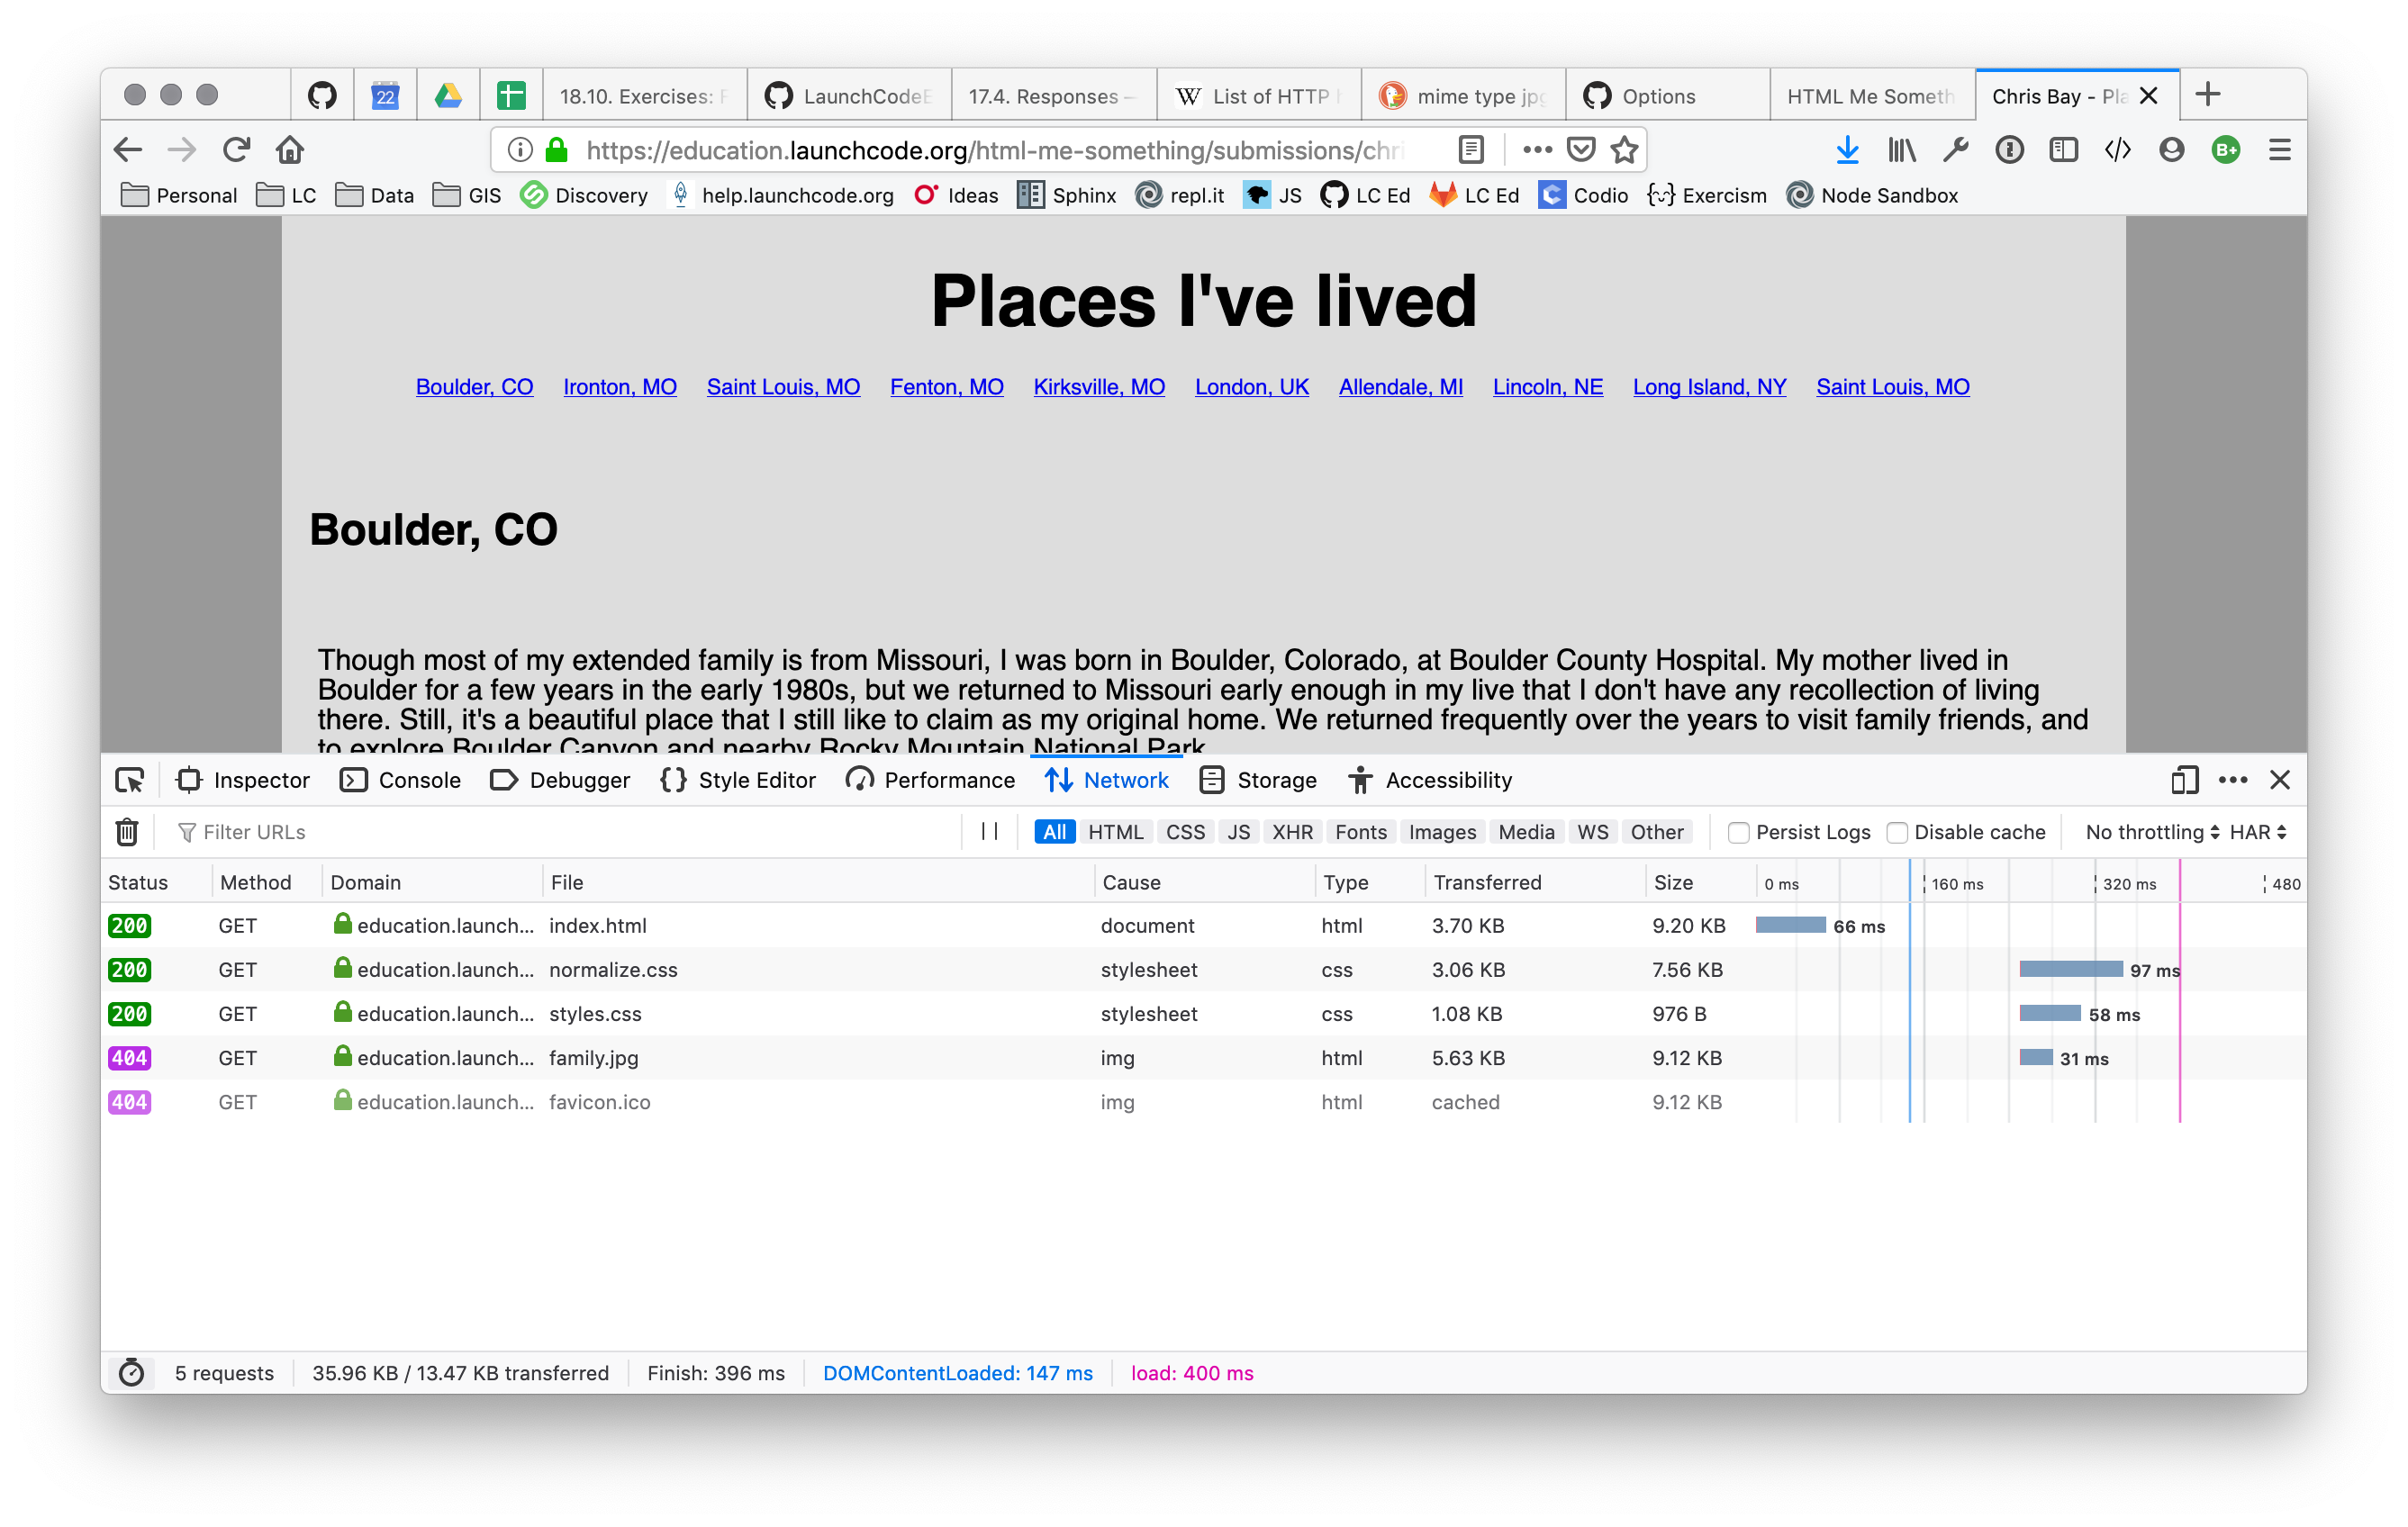
Now you'll see something like this:

Each entry within the pane represents a single HTTP request. A summary of the request is shown in a table format, including the resource requested, server name, response code, and more. Clicking on one of the entries shows more detailed information about the request.

On the right, we see additional request and response details, including response headers and (scrolling down) request headers. We can even view the response body by clicking on the Response label.
Try It!
Navigate to a different page with the Network pane open. Find the response code and Content-Type header for the first request shown in the pane.
As you can see from using the Network pane, loading a single web page usually involves several HTTP requests. Each resource within the page is loaded in a separate request.
Let's examine the flow of loading a page. We'll consider the case of an HTML page with CSS, JavaScript, and images, loaded via a GET request.
This process explains why you will sometimes load a web page, only to see an image on that page load a few seconds later. In such situations, the HTTP request fetching the image takes substantially more time, making it noticeable.
Question
For the first screenshot on this page, answer these questions: