26.3. Studio: Tableau Part 2 - Data Preparation
26.3.1. Getting Started
26.3.1.1. Background:
This dataset used in this studio was created by the Institute of Museums and Library Services (IMLS). We will be exploring data from the Fiscal Year 2014. Documentation of this survey can be found here if you would like to learn more about the survey. The survey collected data for each state and the District of Columbia.
26.3.1.2. Working Through the Studio:
You will be placed into one of eight groups. The group number reflects the region you have been assigned in the table below. As a team, one group member can be in charge of Tableau and screen share while other group members provide direction and suggestions. At the end of the studio, you will present your favorite chart or final dashboard to the class as a whole.
While this is a group assignment, for your own portfolio it is recommended that you make your own version of this studio.
26.3.1.3. Setting Up the Studio:
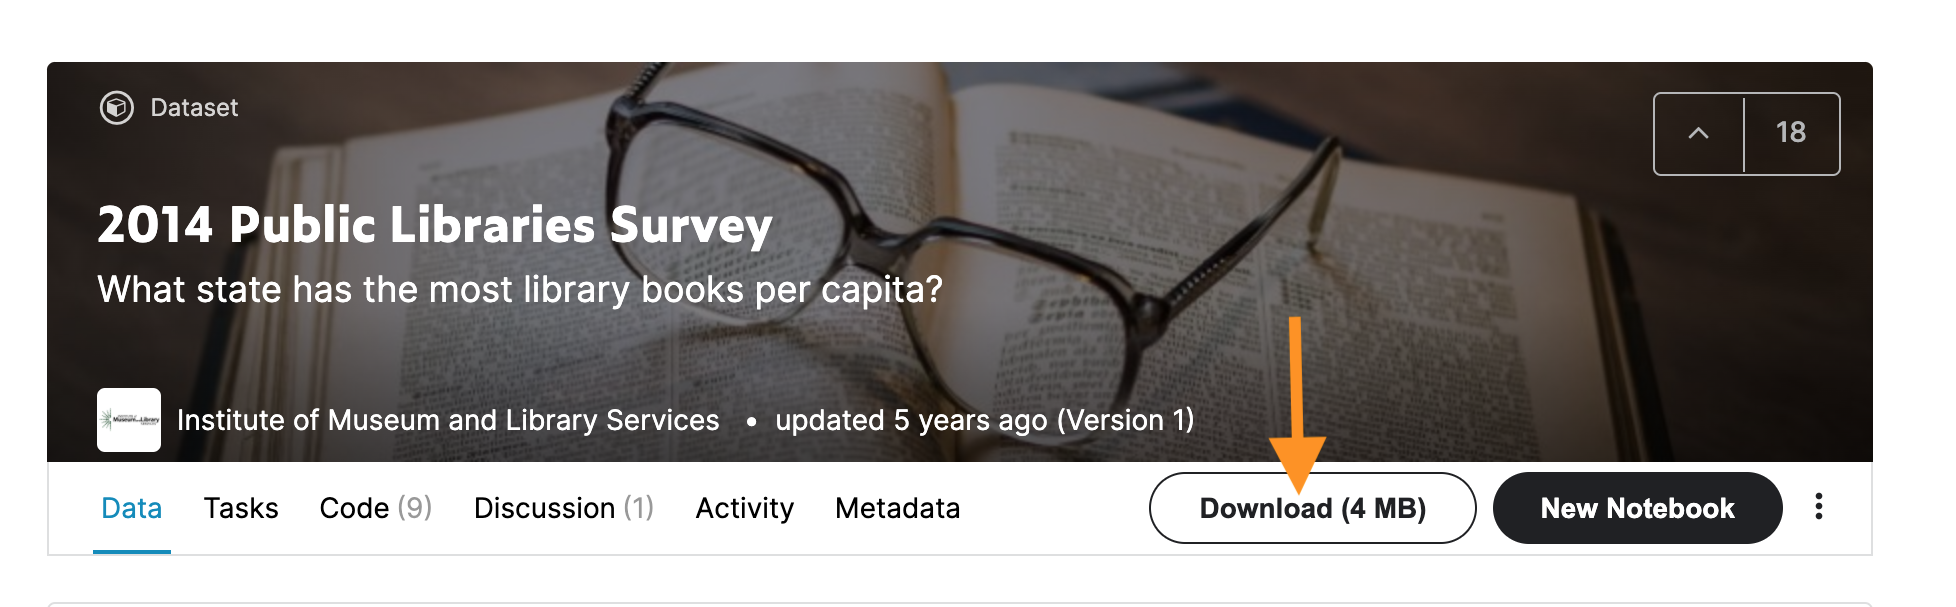
Download library data set. There are 2 CSV files. To download all CSV files at once, click on the “Download” bubble next to the “New Notebook” bubble. An orange arrow is pointing to the “Download” bubble in the image below.
Open the CSV file in Tableau Public.
It is a larger file than we have previously used and may take a few minutes to open.
When you open this data set, you will want to create a relationship between the
libraries.csvfile and thestates.csvfile using branch libraries.Part A invites you to briefly explore the data set. You will explore all the regions of the US.
In Part B, using your assigned region, you will be asked to answer questions using the collection type of your choice: a set or group.
In Part C, you will select 2 (or more) of your favorite charts and create a dashboard that highlights results from your selected region.
Final outcome of this studio will include 9 worksheets (10 if you do the bonus) and 1 dashboard.
US Regional Codes Table |
State Names and Abbreviations |
|---|---|
Region Code 1 - New England |
Maine (ME), New Hampshire (NH), Vermont (VT), Massachusetts (MA), Connecticut (CT), Rhode Island (RI) |
Region Code 2 - Mideast |
New York (NY), Pennsylvania (PA), Maryland (MD), New Jersey (NJ), Delaware (DE), Washington DC (DC) |
Region Code 3 - Great Lakes |
Wisconsin (WI), Illinois (IL), Indiana (IN), Michigan (MI), Ohio (OH) |
Region Code 4 - Plains |
Missouri (MO), Kansas (KS), North Dakota (ND), South Dakota (SD), Minnesota (MN), Iowa (IA), Nebraska (NE) |
Region Code 5 - Southeast |
Virginia (VA), West Virginia (WV), North Carolina (NC), South Carolina (SC), Georgia (GA), Florida (FL), Alabama (AL), Mississippi (MS), Louisiana (LA), Arkansas (AK), Tennessee (TN), Kentucky (KY) |
Region Code 6 - Southwest |
Arizona (AZ), New Mexico (NM), Oklahoma (OK), Texas (TX) |
Region Code 7 - Rocky Mountain |
Idaho (ID), Montana (MT), Wyoming (WY), Colorado (CO), Utah (UT) |
Region Code 8 - Far West |
Alaska (AK), Washington (WI), Oregon (OR), California (CA), Nevada (NV), Hawaii (HI) |
26.3.1.4. Part A: EDA
How many visits occurred in each region?
How does that compare to circulation transactions?
Compare Library Programs against State Population.
Try something other than a bar chart.
Explore the marks card. Add at least one feature.
How many visits in each region compared to the End Date?
Hint: Use the End date from the
libraries.csvfile.Pull other elements from the
states.csvfile.Hide the
Nullvalues in your final viz.
Use the US Regional Codes Table above to create aliases for each region.
Hint: Rename the Region only at this time.
Don’t worry about states right now.
26.3.1.5. Part B: Collect Your Data
Begin working with your assigned region. Remember to use the table above to help with managing and organizing your data and use data from the states.csv table unless otherwise noted.
Create collections to hold your data:
Set Your Data.
Select your region as a set.
We are going to compare your region to the rest of the US.
Give this set a name so that you can easily find and use it.
Group Your Data.
Group the states within your region as a whole.
Give this group a name.
If you used the “State Code” field for your group, you will need to create aliases for the state number to either the name or abbreviation.
For example, “51” becomes “Virginia” or “VA”.
See document page D-44 for the state codes.
Group the states individually.
Give this group a name.
Organizing Your Collections.
If you want to create a hierarchy to better organize your data or drill down at some point, this is your choice.
You can create vizzes with or without hierarchies.
It is your choice.
Questions to Answer with a Viz
Now that you have organized your data, you are ready to explore your region.
Create a new worksheet for each question using either your sets or groups.
How many Central Libraries vs Branch Libraries are in each state within your region?
How many bookmobiles?
Add a tooltip or make an interactive filter card.
How many Young Adult (YA) library programs does each state in your region host and how many individuals attend?
Add a detail and a label to this viz.
Between Central Libraries and Branch Libraries in your region, how many employees are Librarians?
Use the marks card to show data about Librarians.
How many Librarians hold an MLS degree in your region compared to the rest of the US?
Compared to how many Total Staff?
Use a new chart format (if possible).
How do circulation transactions compare between your region and the rest of the US over 2013-2014?
Hint: Use the End Date pill. Hide any Null values, we only want reported values at this time.
Add a label.
26.3.1.6. Part C: Create a Dashboard
Create a dashboard that highlights at least 2 of your favorite charts from the studio. (The bonus can be one of these).
26.3.1.7. Bonus Mission
Within your region, how many children’s programs were distributed by a state by county?
Hint: Drag the State (
states.csv) file into the central plane, and use theMarkscard.Be sure to filter.
Hint: County is a dimension found in the libraries.csv table.
26.3.1.8. Finishing Touches
Before you turn in your vizzes:
Make sure that they are easy to read.
Review and edit any axes so that they don’t contain any file information.
Make sure any filtering, group, or set information is easy to understand.
For example, when using a set the predefined labels may say “In” and “Out”. Would extra context make them easier to understand?
Don’t forget to title your charts.
If you want to explore fonts and colors, go right ahead.
Feel free to change the colors of any/all of your charts.
26.3.2. Submitting Your Work
When finished make sure to save and publish your work to your Tableau Public account. Copy the URL to your published Tableau project and paste it into the submission box in Canvas for Studio: Visualization with Tableau Part 2 and click Submit.