15.1. EDA With Python Part 2
Read the following articles:
15.1.1. pandas Function
15.1.2. Outlier Detection
15.1.3. Missing Data
15.1.4. Univariate and Multivariate Charts
Code along with the article below using the DataCleaning-Heart-Data repo:
15.1.5. Check Your Understanding
Question
The following plot graphs a user’s Spotify recommended song length (in milliseconds) with a song’s energy score (a perceptual measure of intensity and activity between 0 and 1).
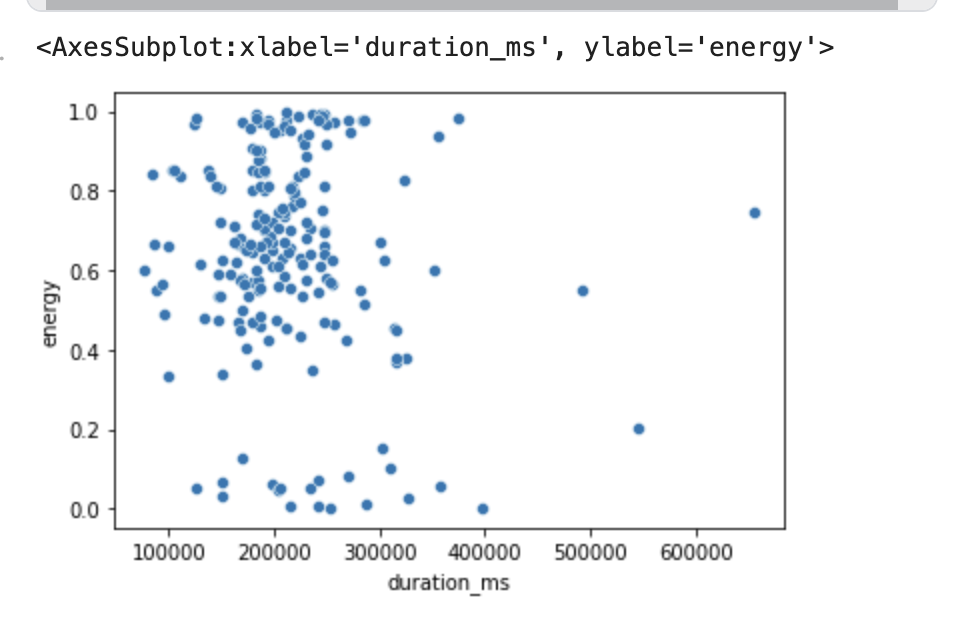
True or False: This graph contains no outliers.
True
False
Question
The National Park Service records the number of visitors to the Gateway Arch in St Louis every day. Occasionally, concerts are held on the park grounds and the number of visitors soars. On concert days, what type of anomaly is the NPS see in their visitor data?
Global anomaly
Contextual anomaly
Collective anomaly
Question
If a dataset is missing values, it is absolutely useless.
True
False
Question
How can data analysts leverage the presence of null values in a data set?
We can create an additional column with a binary type, indicating if any information is missing in the column in question
We can clean the data by removing any missing entries.
We can clean the data by removing any columns with missing entries.
We can’t, Null values serve no purpose in analysis.
Question
Data sets with missing values have been improperly assembled and are rare to encounter in the professional field of data analysis.
True
False
Question
There is no best method for addressing missing data.
True
False