Tableau Workspace Navigation
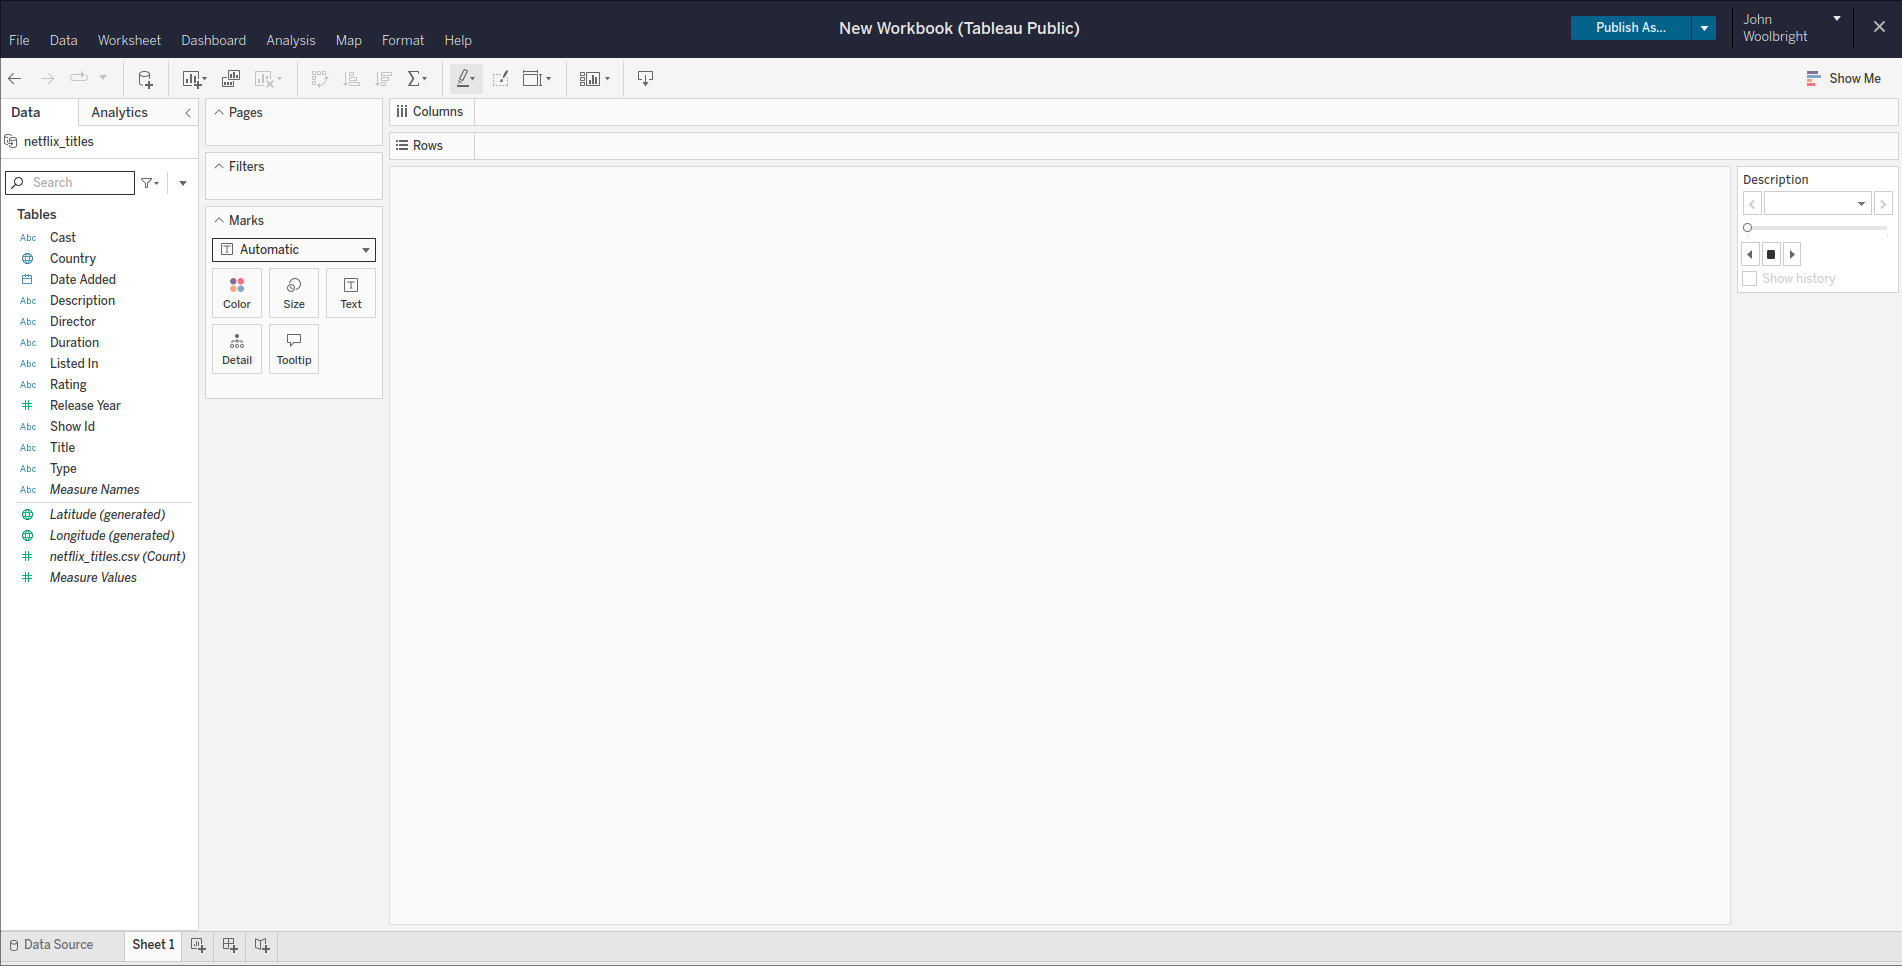
The Tableau public workspace may look familiar enough if you have worked with spreadsheets before. However, it does have unique characteristics that will be important to understand. Tableau features a drag and drop design that makes the entire experience very user friendly, allowing you to plug and play with data very quickly.
Note
This article provides a detailed look into all of the different features available. We will highlight some of them below.
- The area with the label
Sheet 1andDrop field hereis also known as the View. Once you begin to populate the Columns, Rows, or Pages sections, the view will be updated and reflect the data provided. - The side bar area displays tables while the Data Pane is selected. There is another option on the left side bar, which is the Analytics Pane. It is used to apply or add additional analytic objects to your view. The analytics pane usually comes into play if you are looking to apply an aggregate visual to your view.
- The bottom left corner of the workbook displays the Data Source tab, the current Worksheet, and three additional icons to create a new worksheet, a new dashboard, and a new story.
- Once you have created one or more worksheets, you can add them or simply use one to create a dashboard of worksheets.
- The toolbar located just below the area with
File,Data,Worksheet,Dashboard,Analysis,Map,Format, andHelpcontains some useful features that will allow you to highlight, rotate your data or columns, or simply download a worksheet, dashboard, or story to your own machine.
There are many additional features that we will continue to explore in the later readings. But for the time being, familiarize yourself with the above basics. In the following section we will cover how Tableau handles and interprets data in addition to importing data into the workspace.
