Connecting Data
Before we connect a data source to our Tableau workspace, let’s look at what types of data there are, and how those data types are interpreted. You can find official documentation on Tableau Data Types here . Below we will relate the data types in Tableau to previously known data types from Python and SQL.
Data Types in Tableau
- Text: Similar to string values in Python or the varchar type in SQL.
- Date values: Date value (01/29/1992)
- Date and Time values: (01/29/1992 7:07:07 PM)
- Numerical values: Similar to numbers or integers in python
- Boolean values: True or False
- Geographic values: Used to create a geographic role. The geographic role is very useful if you are looking to visualize location data from your data source. When you assign a geographic role, Tableau is kind enough to auto-generate a latitude and longitude value to the associated field. One thing to keep in mind is that the latitude and longitude values are only applicable to numeric fields or values.
- Image role: Field that contains an image
- Cluster Group: Field used to create and associate data into a cluster
One of the many great features that Tableau provides is the ability to change a data type within your data source.
Note
Tableau lists the data type as Text in the documentation, but when changing the data type of a field it is listed as string.
Mixed Data Types
Typically columns within a dataset are the same type of data (string, date, number, etc..).
But, when a column contains data that has more than one data type, Tableau will manipulate the data for you automatically. For example, if you have a column that has both numbers and text, the text will be assigned as Null.
You can find a more detailed explanation of this behavior at the bottom of this page under the section Mixed data types in data from files.
Usually, the issue of having multiple or mixed data types within a column would be identified during EDA and resolved when cleaning data. However, it is good to know what happens with each field when it is imported if you did not complete these steps!
Dimensions and Measures
When you connect to a data source using Tableau, each column within your data set is assigned a data type and field. However, they may not be categorized as the appropriate role (dimension or measure) when you import your data. Fortunately, changing the role of a table or field is very straight-forward.
You are able to right-click any field and convert it to a Measure or Dimension. The easiest way to associate a field with the appropriate role is as follows:
Measure: quantitative values (numerical data)Dimension: qualitative values (non-numerical)
Connecting Data
There are many different types of data and file formats that are valid data sources when working with Tableau. Below are some examples:
.csvfiles.jsonfiles.tsvfiles.xmlfiles
We will be mostly working with .csv (comma-separated values) files.
We will use the Netflix and TV Shows dataset
from Kaggle. Download the dataset from Kaggle or click on the netflix_titles.csv link below to download the CSV file to your machine:
One you have downloaded the netflix_titles.csv file, click on the Data tab in the top left corner and select New Data Source within your Tableau workbook.
Click on the Upload from computer button and navigate to the netflix_titles.csv file on your machine (probably in your downloads folder), and import the file.
Once you have imported the spreadsheet, click on the Sheet 1 tab in the bottom left-hand corner to create a new sheet from the data source.
Example
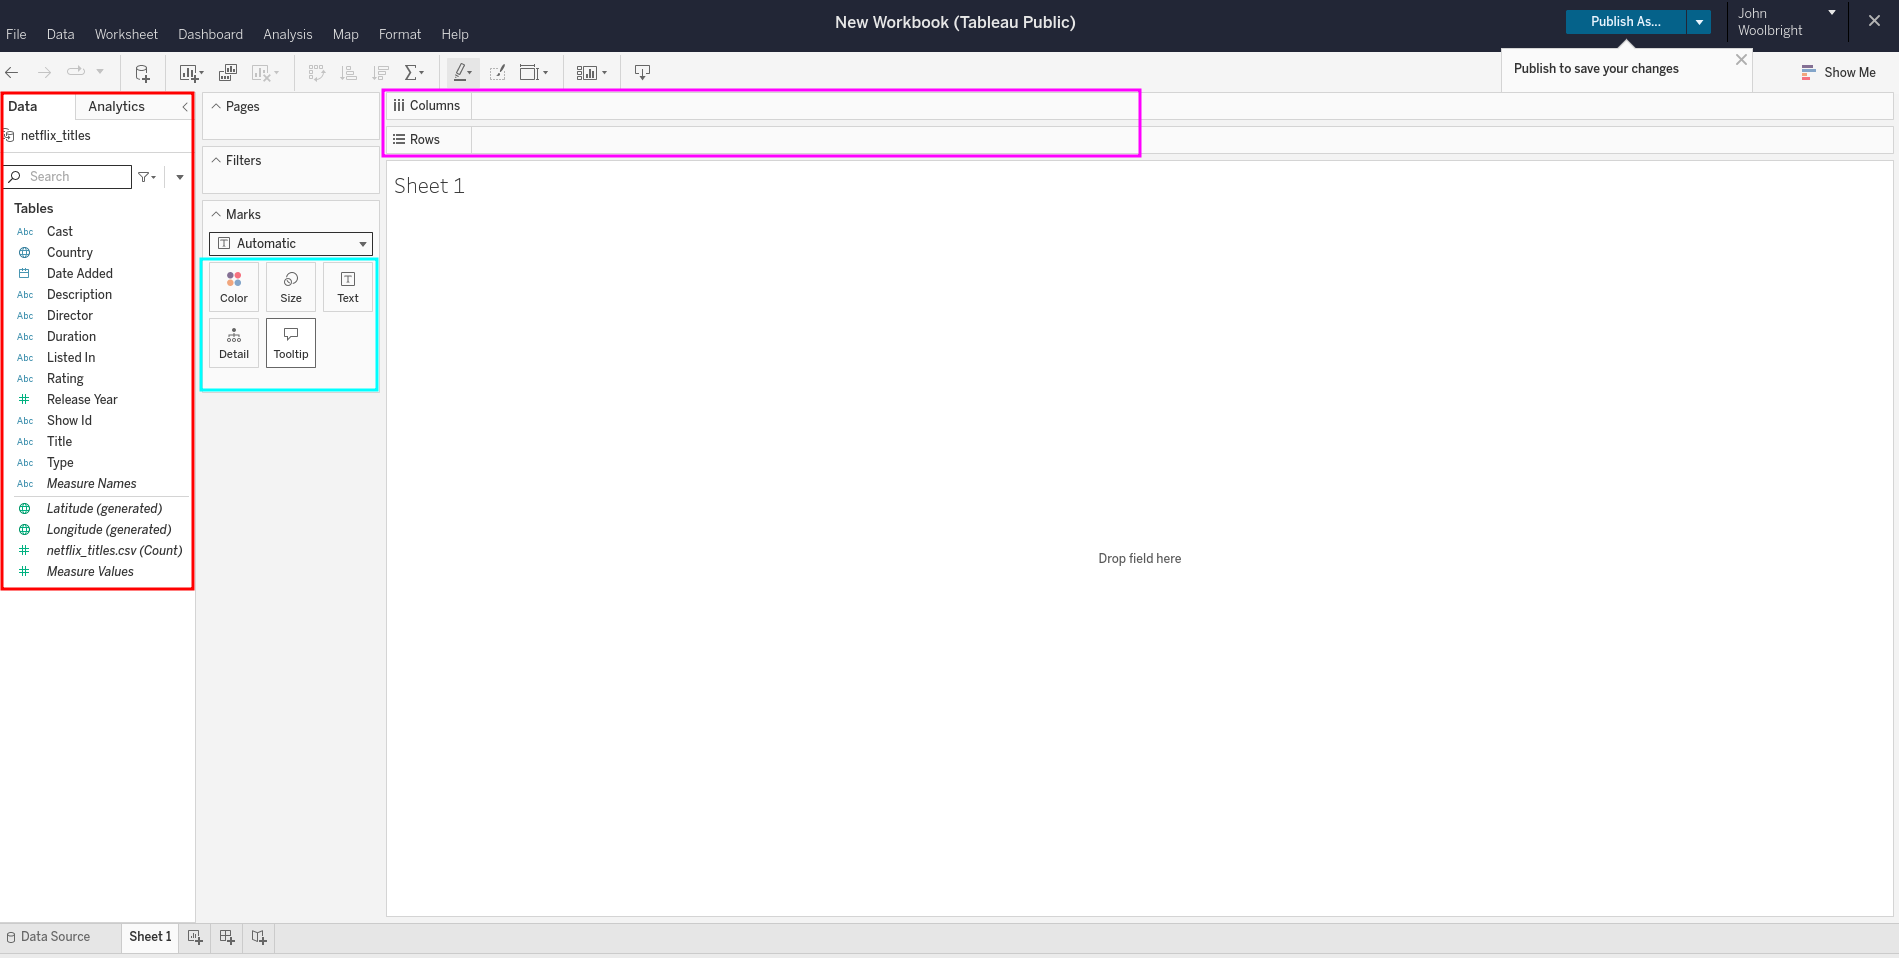
Now that you have connected to a data source and created a new sheet, we want to highlight a few areas.
Within the red box you can view all of the tables associated with the data source/connection and some that were generated automatically by Tableau.
You are now able to drag and drop tables into the various options within the teal box (Color, Size, Text, Detail, Tooltip). You can also drag and drop a newly created Mark or existing table into the Columns or Rows area (highlighted within the purple box).
Note
As you are adding and removing fields and tables from the Columns, Rows, or Mark areas, you may notice they pop up as Blue or Green color coded shapes in the UI. These are called “pills”. You will see this term used in this textbook as well as within other online Tableau materials.
Check Your Understanding
Question
What role is typically assigned to qualitative values?
Question
What role is typically assigned to quantitative values?
Question
How does Tableau handle columns with mixed data types?
