Spreadsheet Mastery: Exercises - Order Summary Report
Scenario
You work as a Data Analyst at Amazon, where your responsibilities encompass both reporting and analysis across various departments. Your team recently received a request for a comprehensive analysis of shipping speed and status for orders shipped to India over the past three months.
After reviewing the initial request, your department director determined that additional preliminary data is needed before proceeding with the full analysis. Specifically, your director wants to understand the overall patterns in the dataset before committing resources to the larger project.
Your director has tasked you with creating a concise Order Summary Report that analyzes sales orders and associated shipping information from March 31, 2022 to June 29, 2022. This report will serve as the foundation for determining whether to move forward with the comprehensive analysis.
The director has also requested detailed information for two sets of sample orders to validate data quality and understand order-level details. The specific Order IDs for these samples have been provided to ensure consistency across analysis.
Requirements
Your director has outlined clear requirements for this Order Summary Report. The report must include the following metrics, KPIs, and sample order information:
- Reporting Period Begin Date.
- Reporting Period End Date.
- Count of days in Reporting Period.
- Date of report preparation.
- Total Order Count.
- Total Unit Count.
- Total Sales Dollars.
- Average Order Value (AOV).
- Average Unit Retail (AUR).
- Units Per Transaction/Order (UPT).
- Sales Dollars and % of Total Sales Dollars by Shipping Status Category.
- Unit Counts and % of Total Units by Cancellation Status.
- Date, Status, Ship Service Level, Units, Dollars, City, State, and Zip Code for these 20 Order IDs:
| Order ID | Order ID |
|---|---|
| 404-2822073-6488362 | 402-3840492-4873917 |
| 407-1425428-0087544 | 408-8226426-6214707 |
| 406-9907647-1673953 | 404-8659996-0325913 |
| 408-0047275-3547510 | 403-1323278-1035515 |
| 408-6217530-3383522 | 406-0203534-2738746 |
| 402-5622441-3675529 | 403-9063524-5621118 |
| 407-0452640-1414754 | 406-9685702-0163562 |
| 403-7617865-0366735 | 407-5692596-2928364 |
| 408-5897470-5138724 | 404-1500003-2290719 |
| 408-7795853-5203551 | 405-6656663-7334729 |
Ship Service Level and Zip Code for these 20 Order IDs:
| Order ID | Order ID |
|---|---|
| 408-0897859-0872345 | 406-5667488-4807518 |
| 404-5192536-7610731 | 404-0385252-9830703 |
| 402-1319583-3594710 | 402-4130969-7199506 |
| 405-0843296-7457920 | 408-7947698-5720302 |
| 402-7607638-8078742 | 402-4065058-6283510 |
| 404-3793288-3303541 | 404-0625941-9181127 |
| 403-6876910-7017123 | 171-7595817-4329100 |
| 405-6575169-1710717 | 408-0894500-2480315 |
| 407-8320886-2189149 | 404-4022285-8367511 |
| 403-8548938-0817920 | 171-5184553-5321935 |
Learning Objectives
By completing this exercise, you will:
- Design and build a professional report template in Excel
- Apply various Excel functions (MIN, MAX, COUNT, SUM, AGGREGATE, SUMIF, VLOOKUP, INDEX/MATCH)
- Calculate key performance indicators (KPIs) for business analysis
- Create structured worksheets with proper formatting conventions
- Validate data accuracy using logical checks and unique value analysis
Tasks
After reviewing the requirements, you recognize that no existing template meets these specifications. A cleaned dataset has been prepared by a colleague and is available as a CSV file. Since your director prefers consolidated deliverables, you will create a single workbook with multiple worksheets to organize the analysis.
Dataset Access: The Order Summary dataset found in Canvas contains all the data needed for this analysis.
Proceed with the following tasks:
1. Set up the workbook structure:
- Download the dataset from Canvas (found within the assignment Exercises: Spreadsheet Mastery)
- Open the file, save it as an Excel Workbook (*.xlsx), and name it “Order Summary Report_Your Name”
- Rename the initial worksheet to “Data”
- Add two new worksheets: “Summary Report” and “Sample Order Data”
- Reorder the worksheets so that Summary Report is first, Sample Order Data is second, and Data is last
- Review the dataset structure and note any observations that will help with your analysis
2. Create report templates:
- Using simple formatting options, create a Summary Report template that matches this mock-up:
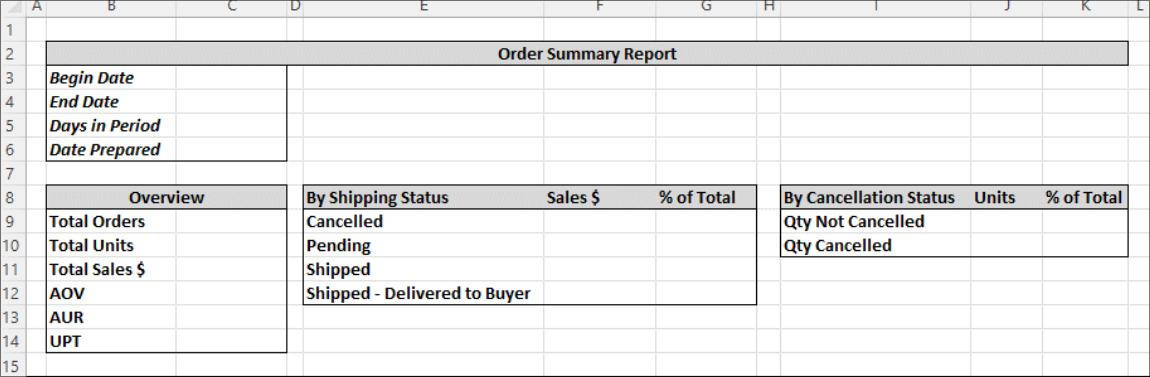
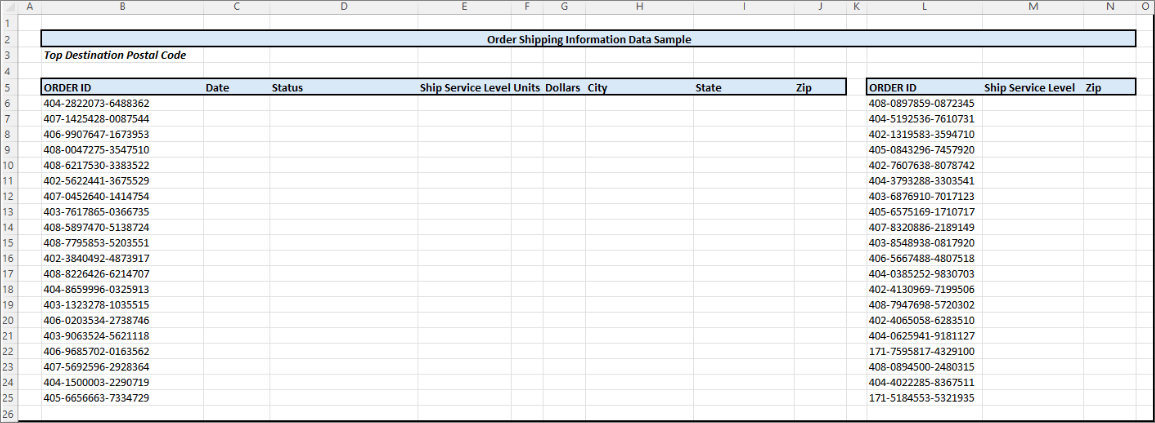
- Create a Sample Order Data template that matches this structure:
Note
Be sure to save any changes as you work and apply number formatting for each metric as you populate the report. Follow the department formatting conventions using the short date format, rounding to whole numbers for total dollar amounts and percentages, and using two decimal places for all KPIs
3. Populate the Summary Report with calculated values:
- Calculate the Reporting Period Begin Date using the MIN function
- Calculate the Reporting Period End Date using the MAX function
- Calculate the Count of Days in Period by finding the range between begin and end dates
- Set the Report Preparation Date using the TODAY function
- Determine Total Orders using the COUNT function
Note
Count either the units or dollars column to get this total since the COUNT function only works on cells populated with numeric data. This is a correct approach because there is one row per order and there aren’t nulls in these columns.
- Calculate Total Units using the SUM function
- Calculate Total Sales $ using the SUM function
- Calculate Average Order Value (AOV) using the AGGREGATE function (AOV = Sales $/Orders)
- Calculate Average Unit Retail (AUR) using cell references and division (AUR = Sales $/Units)
- Calculate Units Per Transaction (UPT) using the AVERAGE function (UPT = Units/Orders)
4. Calculate category breakdowns:
- Determine Sales Dollar amounts for each Shipping Status Category using SUMIF formulas (start with Cancelled status, use cell references rather than hard-coding)
- Calculate % of Total for each Shipping Status Category using division formulas (% of Total = Category Sales $/Total Sales $)
- Calculate Unit Quantities for each Cancellation Status Category using SUMIF formulas with logical operators ("=Cancelled" and “<>Cancelled”)
- Calculate % of Total for each Cancellation Status Category using the same approach
5. Complete sample order analysis:
- Find the Top Destination Postal Code using the MODE.SINGL function
- For the first set of Order IDs, populate Date, Status, Ship Service Level, Units, Dollars, City, State, and Zip Code using VLOOKUP functions
- For the second set of Order IDs, populate Ship Service Level and Zip Code using INDEX and MATCH functions
6. Validate and finalize:
- Verify all functions return accurate results
- Confirm percentage totals for Shipping Status and Cancellation Status sum to 100%
- Apply proper number formatting (short date format, whole numbers for dollar amounts and percentages, two decimal places for KPIs)
- Use UNIQUE function to identify all distinct category options for validation
Submission
Your director has requested the completed report for review and mentioned that additional requirements may follow based on initial feedback.
Deliverable: Upload your completed Microsoft Excel Workbook (“Order Summary Report_Your Name.xlsx”) under Exercises: Spreadsheet Mastery in Canvas.
Before submitting, confirm:
- All calculations are accurate and formulas are working correctly
- Number formatting follows department conventions
- All required metrics and sample order information is included
- Worksheets are properly organized and labeled