Spreadsheet Mastery Project: Part 2 - Cancelled Orders Enhancement
Scenario
Your department director reviewed the different PivotTable components that you created for the Mockup in the Spreadsheet Mastery Exercises Part 2 and was pleased with the various options and professional design approaches you developed.
While your director was reviewing these options with stakeholders, they requested an enhancement to the original specifications: they want additional detail specifically focused on cancelled orders. This deep-dive analysis will help them understand cancellation patterns and identify potential areas for operational improvement.
Your director sends you an email requesting that you create a Cancelled Order Summary page and a Cancelled Order Detail page, then resubmit the workbook for review.
Requirements
Create enhanced analysis focused on cancelled orders:
- Cancelled Order Detail page - Detailed transaction-level data for all cancelled orders
- Cancelled Order Summary page - Interactive dashboard with PivotTable and visualization
- Dynamic summary calculations that remain accurate when users filter the data
- Peak cancellation analysis to identify the highest-impact cancellation date
Learning Objectives
By completing this project, you will:
- Extract detailed data from PivotTables using drill-down functionality
- Build summary dashboards that combine PivotTables, charts, and calculated metrics
- Create formulas that reference table data instead of PivotTable ranges for stability
- Apply advanced nested functions (INDEX, MATCH, MAX, COUNTIF) for complex analysis
- Design interactive visualizations that update dynamically with data filters
Tasks
Starting Point: Use your completed PivotTable mockup workbook from the Spreadsheet Mastery Exercises Part 2.
1. Extract cancelled order data:
- Double-click the
Cancelled Order Countvalue in PivotTable 1 to extract detailed data - Rename the new worksheet from “Detail1” to “Cancelled Order Detail”
- This creates a dedicated table with all cancelled order transaction details
- Click in any cell on the detail table, then click the “Table” tab in the top ribbon. Rename the table from the default name to something more descriptive, like
cancelled_orders. This will make any forumlas that you write referencing this table much easier to understand.
2. Create cancelled order summary dashboard:
- Insert a PivotTable in cell T2 of a new worksheet named “Cancelled Order Summary”
- Configure the PivotTable with Date in rows and Order Count in columns
- Rename column headers to match your established naming conventions
- Create a line chart displaying order count by day with title “Daily Cancelled Orders”
- Format chart with “Order Count” vertical axis label and “Date” horizontal axis label (remove legend)
- Position chart in columns A-S to maximize workspace utilization
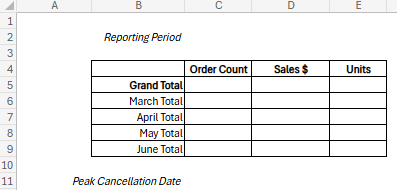
3. Build summary template and reporting period display:
- Create a summary template above the line chart matching this design:
- In cell C2, create a formula to display the reporting period in custom format by referencing the Date column in the detail table:
![excel formula for displaying the reporting period, which reads “=TEXT(MIN(cancelled_orders[Date]), “mmm d, yyyy”) & " - " & TEXT(MAX(cancelled_orders[Date]), “mmm d, yyyy”)”](https://education.launchcode.org/data-analysis-curriculum/projects/project-part-2/pictures/formula-1.png)
4. Test PivotTable interaction and understand formula stability:
- Initially populate Grand Total using SUM formula referencing PivotTable range (U3:U97)
- Then, collapse the entire Date column to display only the month summaries and observe the impact on the Grand Total Order Count calculation.
- Try expanding just the month of April, and again note the impact. Experiment with various combinations of months expanded and collapsed. Can you piece together what is going on?
- Next, edit the Design of the PivotTable so that it does not show subtotals.
- Repeat your experimentation with expanding and collapsing the values in the PivotTable. Is the Grand Total value still changing?
- Since design decisions can impact the result of a calculation that references a PivotTable range, it’s considered an unreliable source for calculation fields. Although we discovered that removing subtotals fixed this particular issue, you don’t want to rely on needing to maintain certain design or presentation decisions just to make your calculations correct.
- For this reason, it’s considered best practice to reference the data you’re working with directly, rather than referencing a PivotTable that was built using the data of interest
- If you prefer the aesthetic of having subtotals shown in the PivotTable, turn them back on. In the next section, we will build our formula using best practices instead.
5. Create stable summary calculations:
- Populate Cancelled Order Grand Total using COUNTA function on the Order ID column from the Cancelled Order Detail table
- Calculate monthly totals using COUNTIF for March and COUNTIFS with logical operators for April, May, and June:
![excel formula for calculating monthly totals, which reads: =COUNTIFS(cancelled_orders[Date],">=StartDate", cancelled_orders[Date],"<=EndDate")"](https://education.launchcode.org/data-analysis-curriculum/projects/project-part-2/pictures/formula-2.png)
- Validate that March + April + May + June totals reconcile to the Cancelled Order Grand Total
- Apply the same approach to calculate Sales $ and Units for all periods (Grand Total, March, April, May, June)
- Confirm that monthly aggregates sum to Grand Total values
6. Implement advanced peak analysis:
- Find the Peak Cancellation Date using nested functions INDEX, MATCH, MAX, and COUNTIF
- Build the formula step-by-step to understand how the functions work together:
![excel formula for finding peak cancellation date, which reads “=INDEX(cancelled_orders[Date], MATCH(MAX(COUNTIF(cancelled_orders[Date], cancelled_orders[Date])), COUNTIF(cancelled_orders[Date], cancelled_orders[Date]), 0))”](https://education.launchcode.org/data-analysis-curriculum/projects/project-part-2/pictures/formula-3.png)
- Verify that the calculated Peak Cancellation Date corresponds to the highest point displayed in your line chart
Submission
With the Cancelled Order Summary and Detail pages complete, you’re ready to submit the enhanced workbook to your director for additional review.
Deliverable: Upload your Microsoft Excel Workbook to Canvas under Spreadsheet Mastery Project: Part 2.
Before submitting, confirm:
- Cancelled Order Detail worksheet contains complete transaction-level data for all cancelled orders
- Cancelled Order Summary dashboard includes properly formatted PivotTable, chart, and summary template
- Summary calculations reference the detail table (not PivotTable ranges) for stable results
- Monthly totals reconcile to Grand Total calculations
- Peak Cancellation Date formula works correctly and matches chart visualization
- All formatting is professional and consistent with your established design standards