Reshaping Tables
As you continue to answer questions about your data during the exploration and cleaning stages, you may want to reformat or reshape your tabular data. Below we will cover some common functions used when reshaping your dataset so that you can not only visualize it differently but also gather data related to a specific question you have.
.concat() function
The .concat() function has many use cases, one of which is to join multiple DataFrames together, combining their datasets into one. It has the capability to join along the rows or columns of a DataFrame.
Syntax
dataset_one = [1, 2, 3]
dataset_two = ["four", "five", "six"]

dataframe_one = pd.DataFrame(dataset_one)
dataframe_two = pd.DataFrame(dataset_two)

combined_dataframe = pd.concat([dataframe_one, dataframe_two])
Example
movie_dictionary = {
    'Name': ["Interstellar", "Pride and Prejudice", "Inception", "Barbie"],
    'Release': [2014, 2005, 2010, 2003],
}

genre_rating_dictionary = {
    'Genre': ["Science Fiction", "Novel", "Science Fiction", "Comedy"],
    'Rotten Tomatoes Score': [73, 87, 87, 88]
}

movie_dataframe = pd.DataFrame(movie_dictionary)
genre_rating_dataframe = pd.DataFrame(genre_rating_dictionary)

movie_genre_dataframe = pd.concat([movie_dataframe, genre_rating_dataframe])
Output
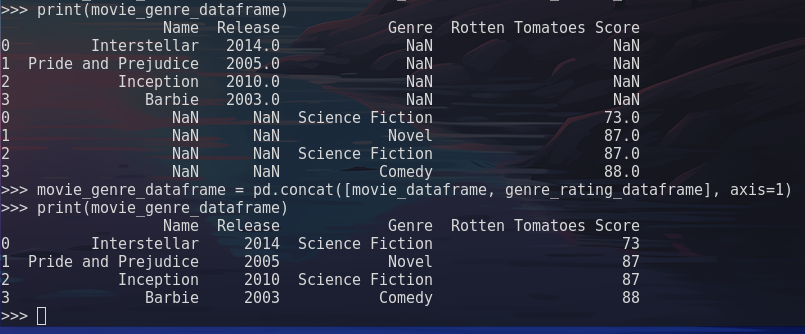
Note in the output image above the inclusion of the axis parameter when printing the dataframe a second time. The axis parameter specifies that the two DataFrames should be joined along the columns instead of rows, providing a cleaner dataset.
In the lesson on exploring data with python we covered how to create a DataFrame using the .concat() method by providing two Series as parameters. The .concat function can also be used to add a Series within an existing DataFrame!
Example
import pandas as pd

data = ["movies", "genres", "release_year"]
series_data = ["interstellar", "pride and prejudice", "barbie"]

example_dataframe = pd.DataFrame(data)
example_series = pd.Series(series_data)

concat_series_dataframe = pd.concat([example_dataframe, example_series], axis=1)
Merging DataFrames
The .merge() function is used to combine two DataFrames based on common columns or indices, similar to SQL joins. Unlike .concat() which simply stacks DataFrames, .merge() intelligently combines rows based on matching values in specified columns.
Common Merge Types
There are four main types of merges:
inner: Returns only rows with matching values in both DataFrames (default)left: Returns all rows from the left DataFrame and matching rows from the rightright: Returns all rows from the right DataFrame and matching rows from the leftouter: Returns all rows from both DataFrames, filling in missing values with NaN
Syntax
merged_dataframe = pd.merge(left_dataframe, right_dataframe, on="column_name", how="inner")Example
import pandas as pd

# Create two DataFrames with a common column
passengers = pd.DataFrame({
    'passenger_id': [1, 2, 3, 4],
    'name': ['John', 'Jane', 'Bob', 'Alice'],
    'age': [25, 30, 35, 28]
})

tickets = pd.DataFrame({
    'passenger_id': [1, 2, 3, 5],
    'ticket_class': ['First', 'Second', 'Third', 'First'],
    'fare': [100, 50, 25, 100]
})

# Inner merge - only passengers with tickets
inner_merged = pd.merge(passengers, tickets, on='passenger_id', how='inner')

# Left merge - all passengers, with ticket info if available
left_merged = pd.merge(passengers, tickets, on='passenger_id', how='left')
The inner merge will return only the 3 passengers (IDs 1, 2, 3) that exist in both DataFrames. The left merge will return all 4 passengers, with NaN values for the ticket information of passenger 4 who doesn’t have a ticket.
Merging on Multiple Columns
You can merge on multiple columns by passing a list to the on parameter:
merged_dataframe = pd.merge(df1, df2, on=['column1', 'column2'], how='inner')Merging with Different Column Names
If the columns to merge on have different names in each DataFrame, use left_on and right_on:
merged_dataframe = pd.merge(df1, df2, left_on='id', right_on='passenger_id', how='inner')Sorting Values
The .sort_values() function allows you to reshape data to your specific use case. The below parameters are some of the more common:
by: Name of column(s) or list of column(s) to sort byaxis: Which axis to perform the operations on (0or1)ascending: Sort the data in ascending or descending order
Note
The above parameters are not the only ones available when using the .sort_values() function. If you would like a more extensive list you can view them here: pandas docs
Syntax
data.sort_values(by="column_name", ascending=True)Example
Pivot Tables
Pivot tables are often used to provide summary statistics through aggregate functions while reorganizing your data.
Below are some of the commonly used parameters:
values: column(s) to aggregateaggfun: aggregate function to applyindex: column to index by
Syntax
data.pivot_table(values="column-name", aggfunc="", index="")Example
import pandas as pd

pivot_table = data.pivot_table(values='age', aggfunc='mean', index='alive')
print(pivot_table)
Output
The above code accomplishes the following:
- Imports pandas
- Creates a pivot table using the
agecolumn with thealivecolumn as the index, applying themeanfunction to agggregate the data. - The output displays the average age of people alive, and not alive.
Wide vs Long Format
Pandas has the ability to reshape tabular data from wide to long and vice versa. Before we dive into how to reformat the data, let’s talk about the difference between wide format, and long format, as it relates to tabular data.
Wide format can be thought of as a dataset that includes many columns of data as it relates to similar items. For example, a dataset could hold a column for each type of food (chips, fruit, snack bar) or beverage (coffee, tea, water, soda) an office provides to its employees. This would be considered wide format and would be displayed as follows:
| chips | fruit | snack bars | coffee | water | soda |
|---|---|---|---|---|---|
| red hot riplets | bananas | kind bar | kaldis | filtered water | coke |
| lays potato chips | apples | kelloggs protein bar | starbucks | bottled water | pepsi |
The same data in long format:
| Office Item Category | Office Item Name |
|---|---|
| chips | red hot riplets |
| chips | lays potato chips |
| fruit | bananas |
| fruit | apples |
| snack bars | kind bar |
| snack bars | kelloggs protein bar |
| coffee | kaldis |
| coffee | starbucks |
| water | filtered water |
| water | bottled water |
| soda | coke |
| soda | pepsi |
But why would you want to use long format over wide format?
- Readability: Long format is easier to read and visualize than wide format.
- Manipulating the data: Using the above data as an example, it is much easier to manipulate the data using only two columns instead of six.
- Compute: Less columns means less compute and memory needed from the host machine to perform the tasks necessary for your analysis.
This does not mean that wide format isn’t useful. If you have a smaller dataset without many columns, or if it makes it easier to simply keep the columns of data separate, wide format is perfectly fine!
Melt
Now that we have covered the differences between the two, let’s take a look at how the .melt() function can be used to reshape tables from wide format to long format. The .melt() funtion takes an existing DataFrame, creating two columns from the data within.
Syntax
| |
Example
| |
Output
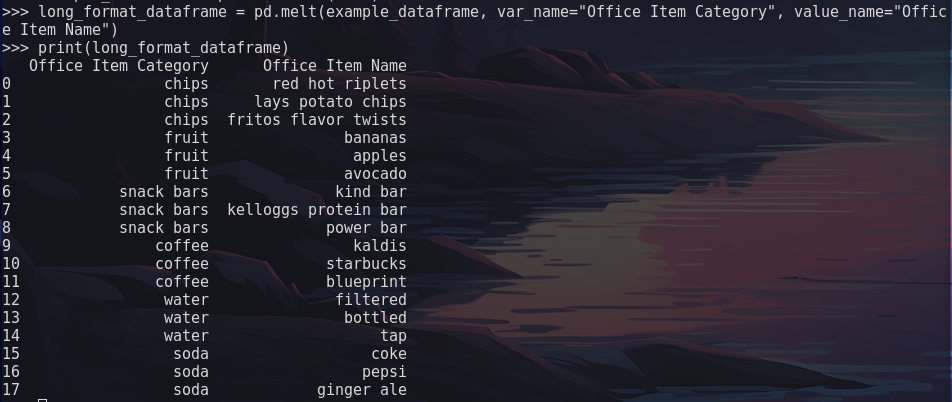
The above code accomplished the following:
- Imported pandas
- Created a DataFrame called
example_dateframefrom the variabledataholding a dictionary - Create a new DataFrame object called
long_format_dataframeusing the.melt()function- the
var_nameparameter specifies the column name that will hold column labels from theexample_dataframe - the
value_nameparameter specifies the column name that will hold column values from theexample_dataframe
- the
- Printed the new DataFrame object to the console


